Spatial Analysis
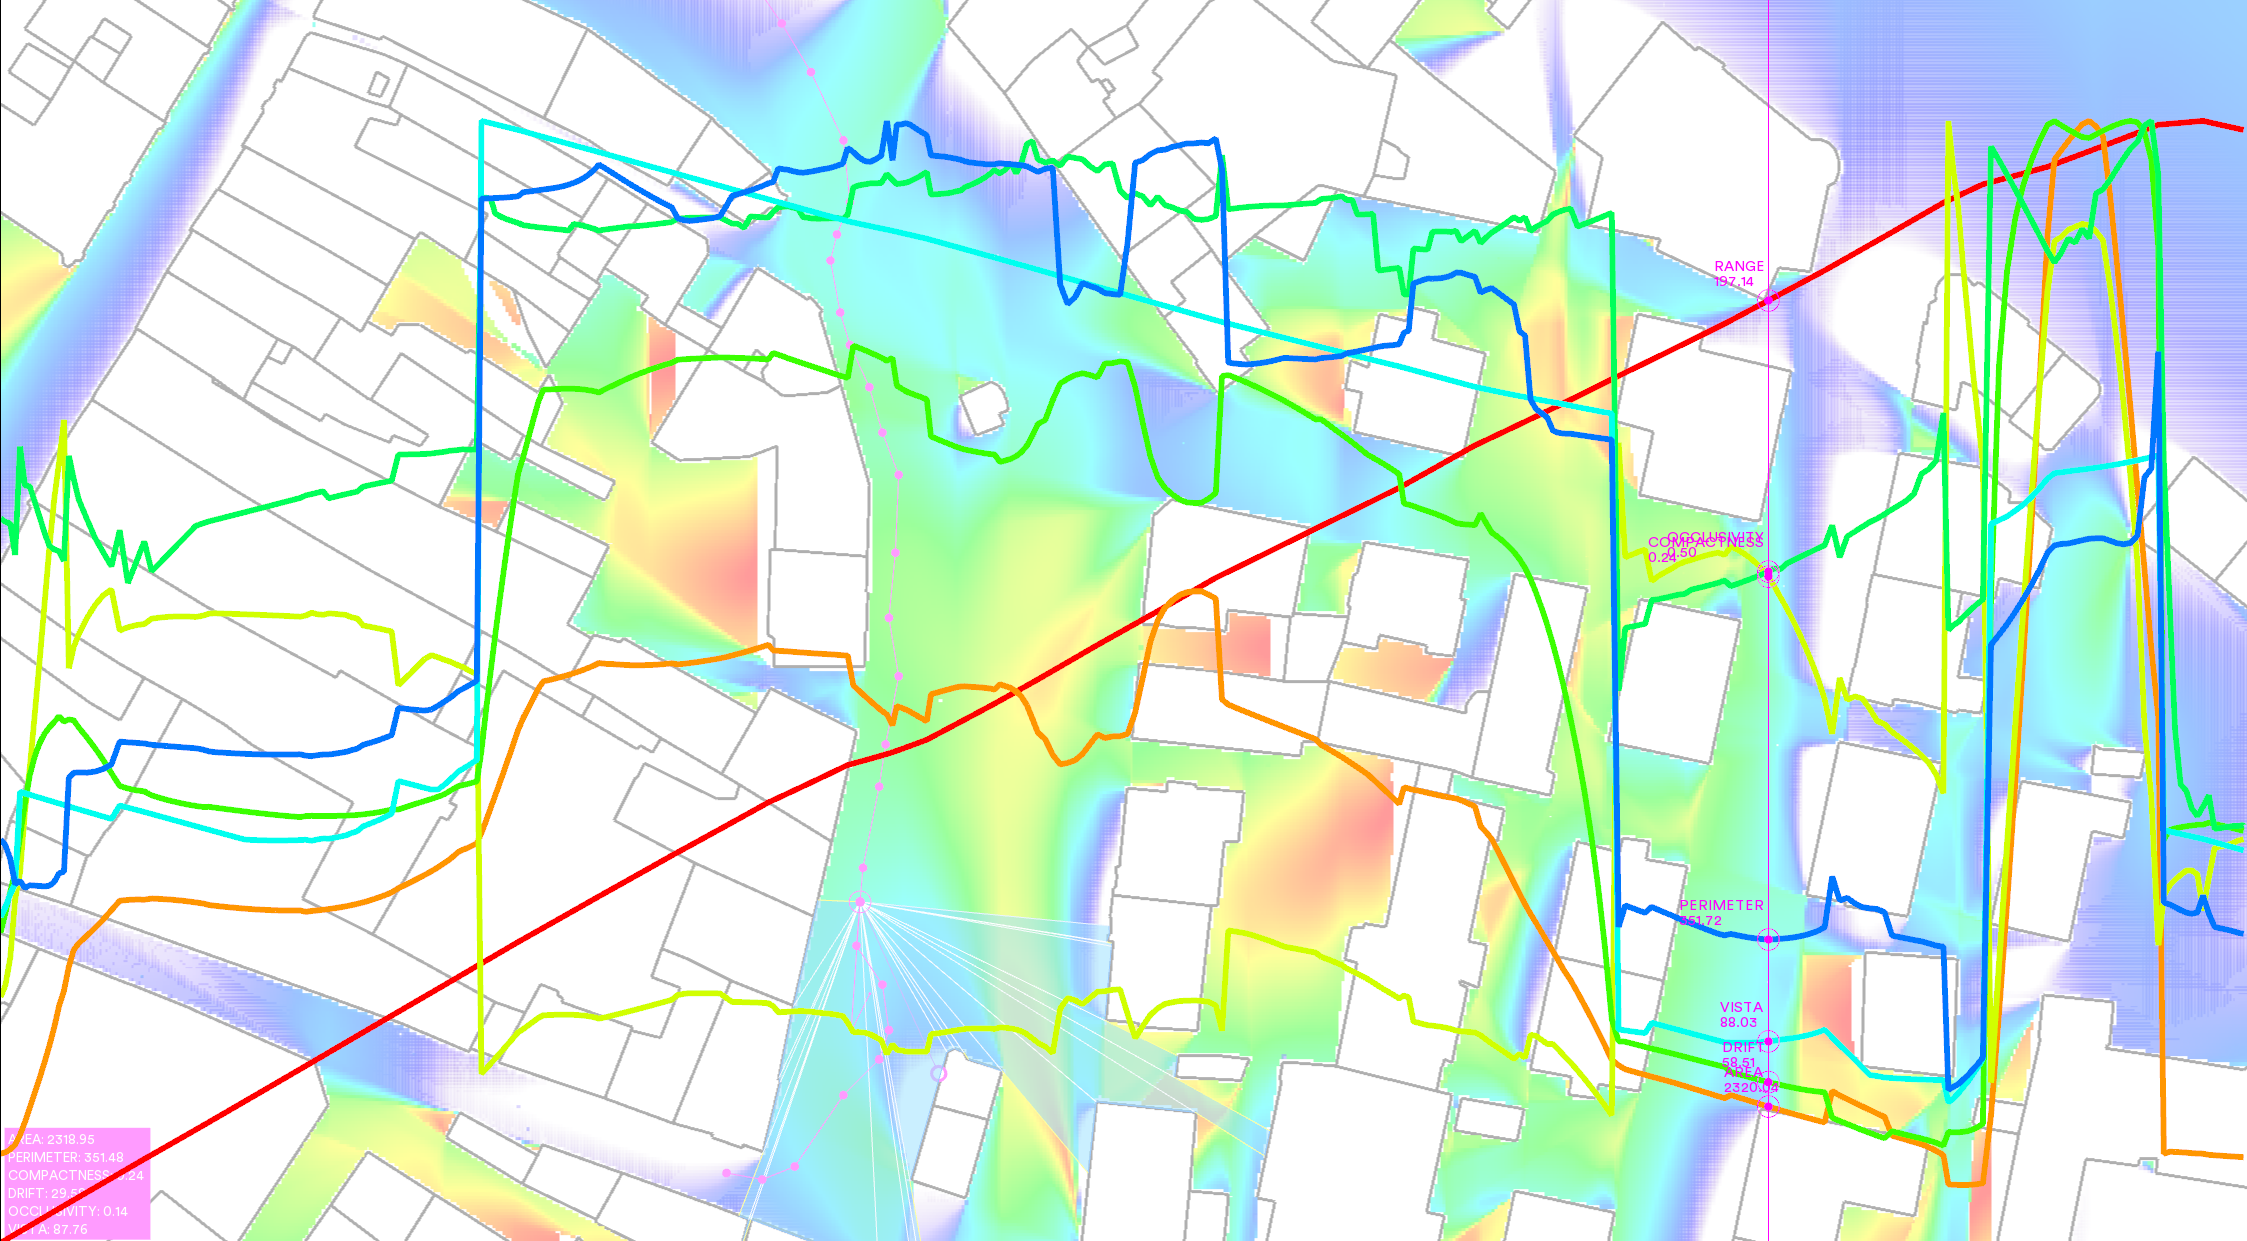
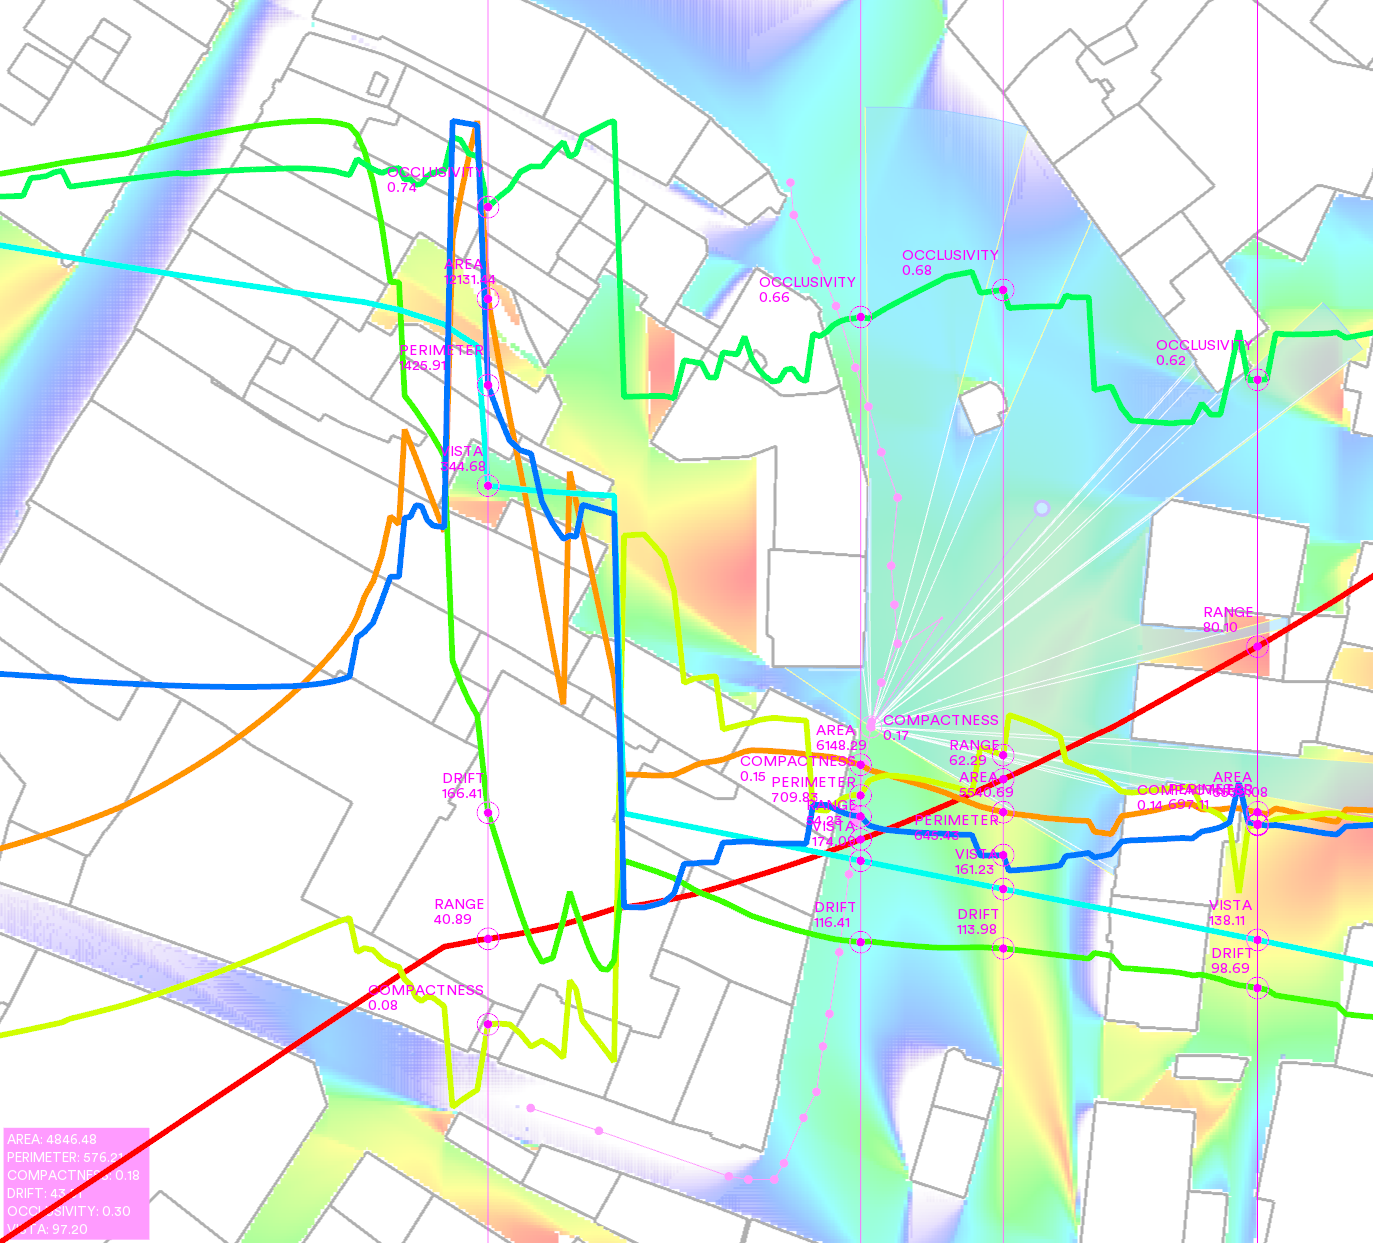
For all diagrams in the following isovist.org software has been used [1] using:
Download plan: .dwg file
Sweep = 180°
Far Rim = 40%
Scan Settings > Unit Scale > Scale = 17
Creating a figure-ground plan (Schwarzplan) with QGIS for export
Converting geo-data shape files (.shp) to dxf can be done using QGis. In this case we need the .dxf for using it in isovist.orgs analysis software, but there are a number of othere cases one might need this conversion workflow. e.g. creating a figure-gound plan.
-
Get some Geo-Data Download the geo-data shape file (.shp) of the “Hausumringe” at the OpenData Bayerischen Vermessungsverwaltung https://geodaten.bayern.de/opengeodata/index.html
-
Import shape layer in QGis
- Click Layer > "Data Source Manager"
- For "Vector Dataset(s)", select your downloaded .shp file
-
Click Add and close the window. A new layer is added in the Layer Tab.
-
Extract area of interest
- To make the Layer editable, right click on the new layer and select “Toggle Editing”.
- Zoom in to your area of interest and select the area by clicking on “Select Features by Polygon” or “Select Feature by Rectangle”.
-
Go to “Invert Feature Selection” and delete the unwanted shapes in the figure-ground plan.
-
Create a DXF file
- Project > Import/Export > "Save Project as DXF"
- Insert file name and click OK.
Isovist Analysis
Area
Perimeter
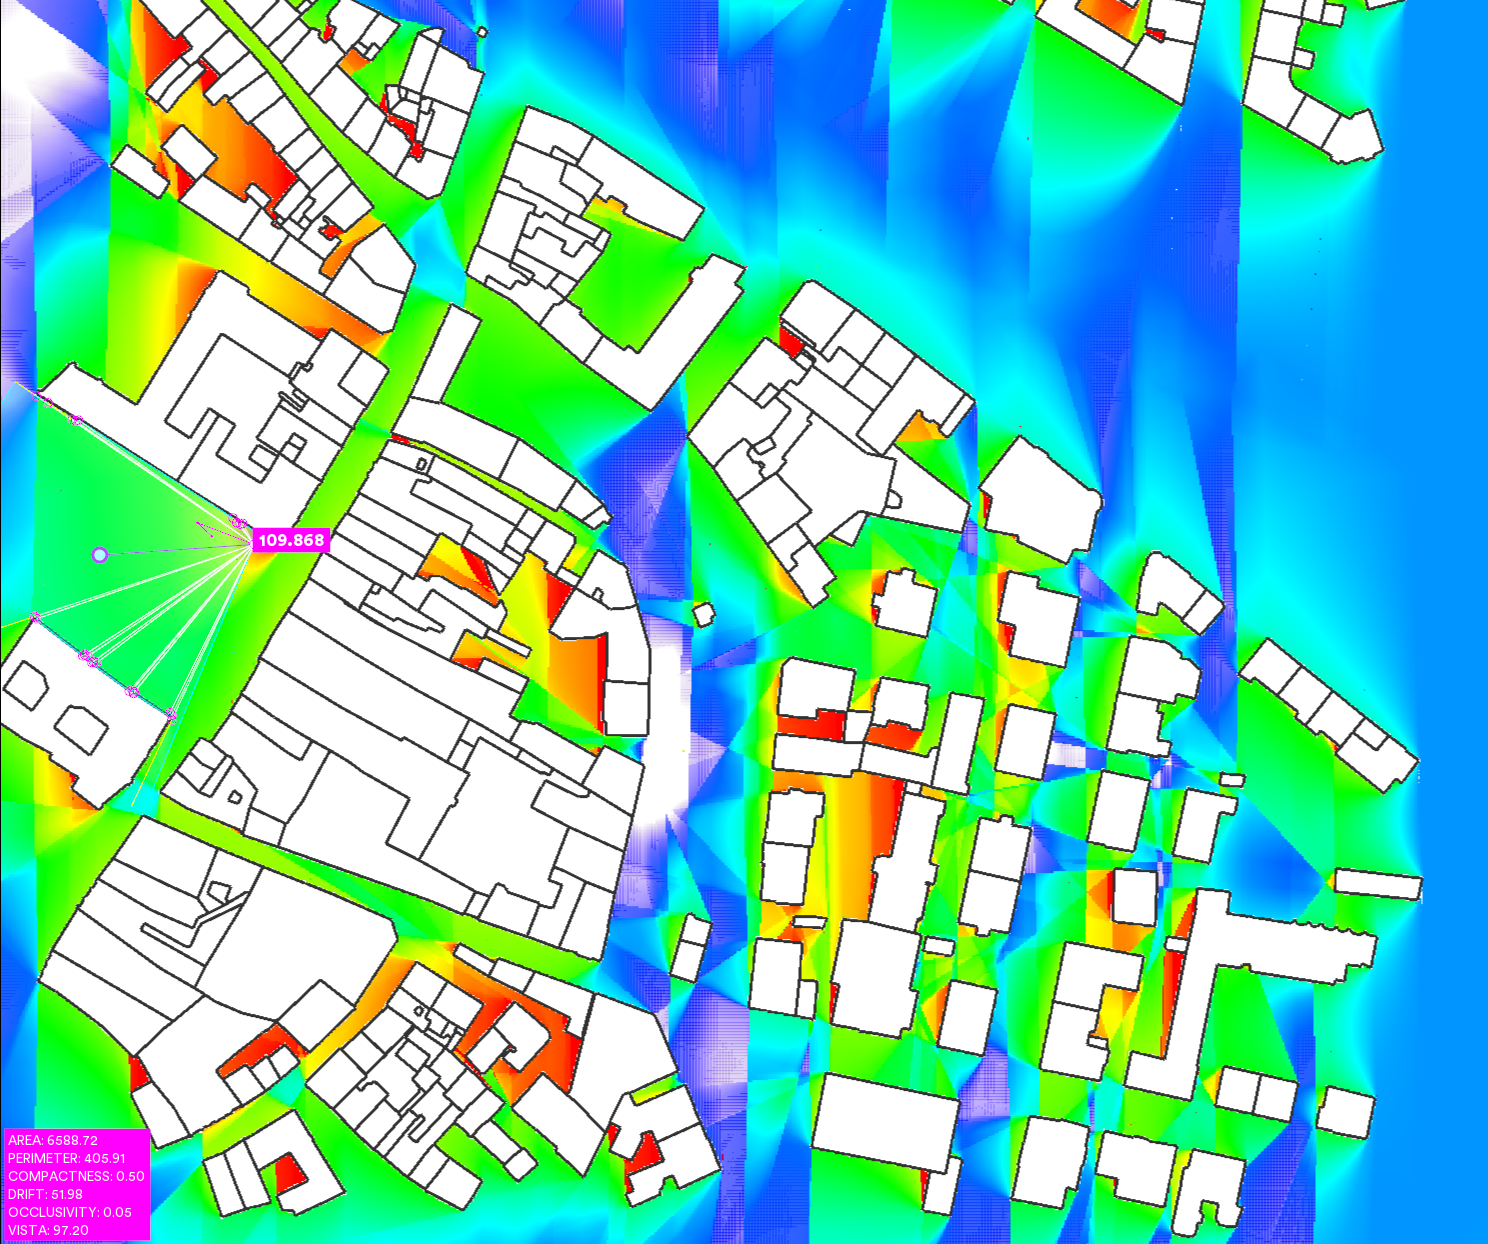
Perimeter (Pv) expresses the length of the edge of all space visible from a location.
Closed Perimeter
Closed Perimeter (Uv) expresses the length of the closed edges (i.e. solid walls) of all space visible from a location.
Compactness
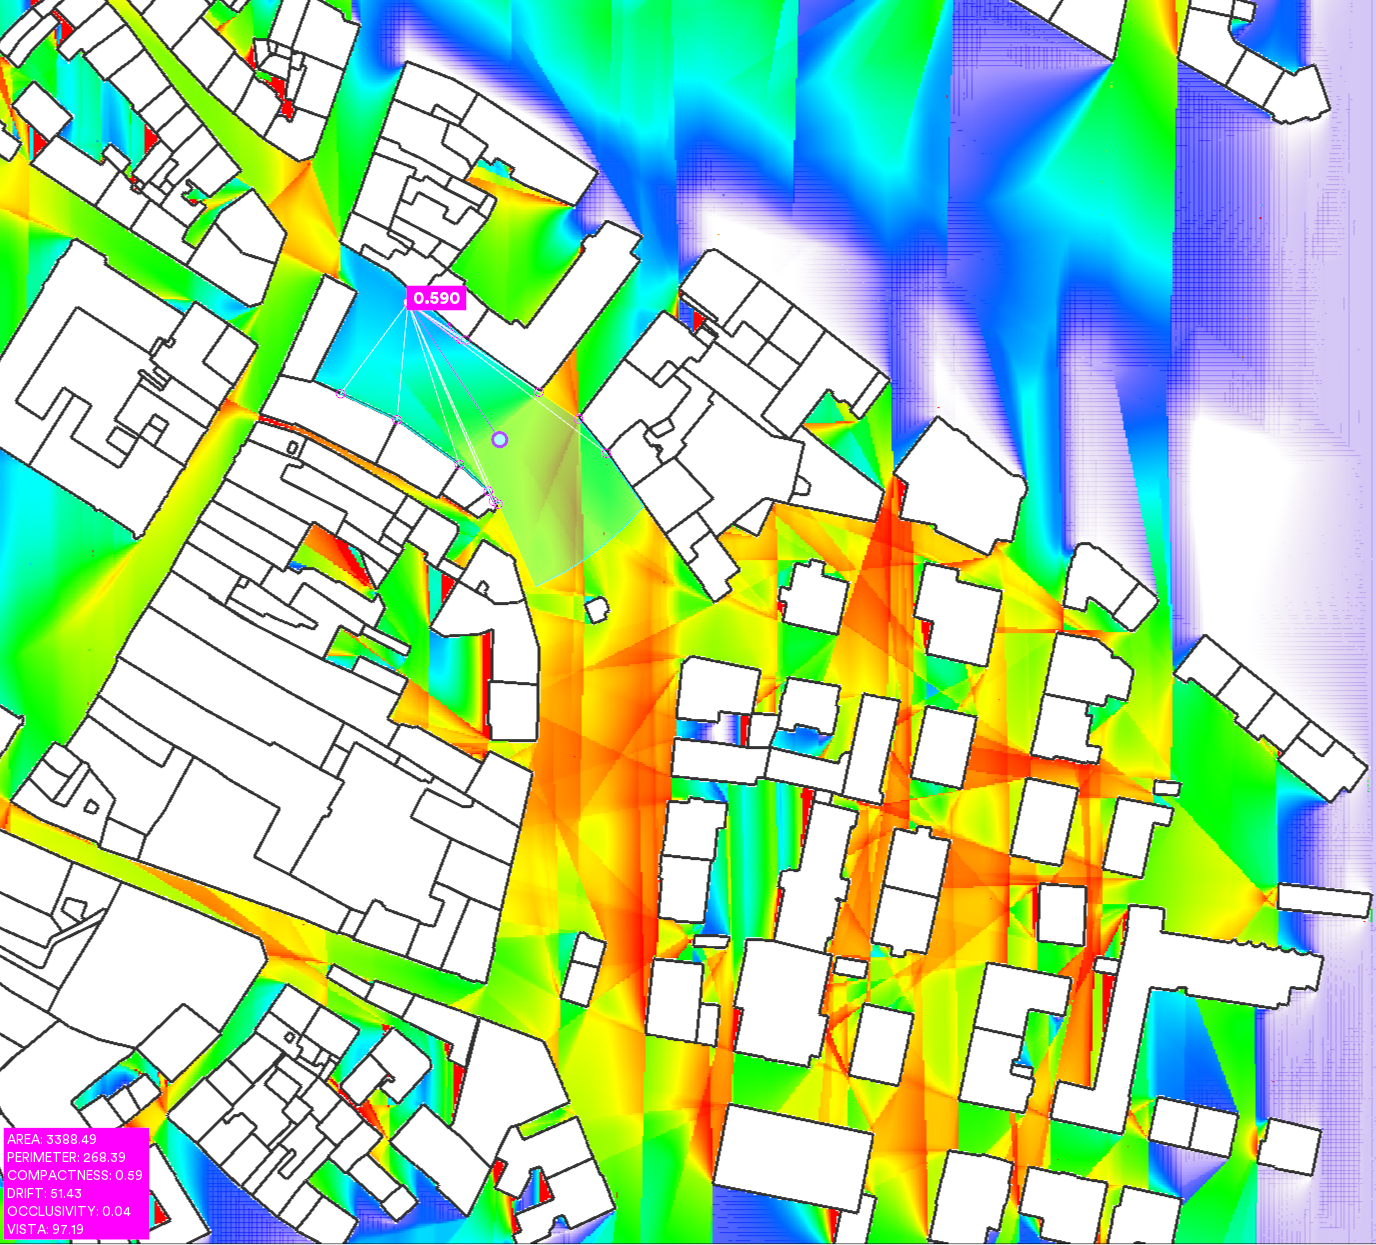
Compactness (Cv) expresses the shape property (relative to a circle) of all space visible from a location. In an isovist field, compactness identifies the regions of plan in which an observer’s spatial experience is contiguously consistent. Such regions identify and correlate to meaningful instances of Peponis’ S- and E-partitions [3] identifying opportunities for the emergence of new surfaces in the visual field as a result of movement.
Occlusivity
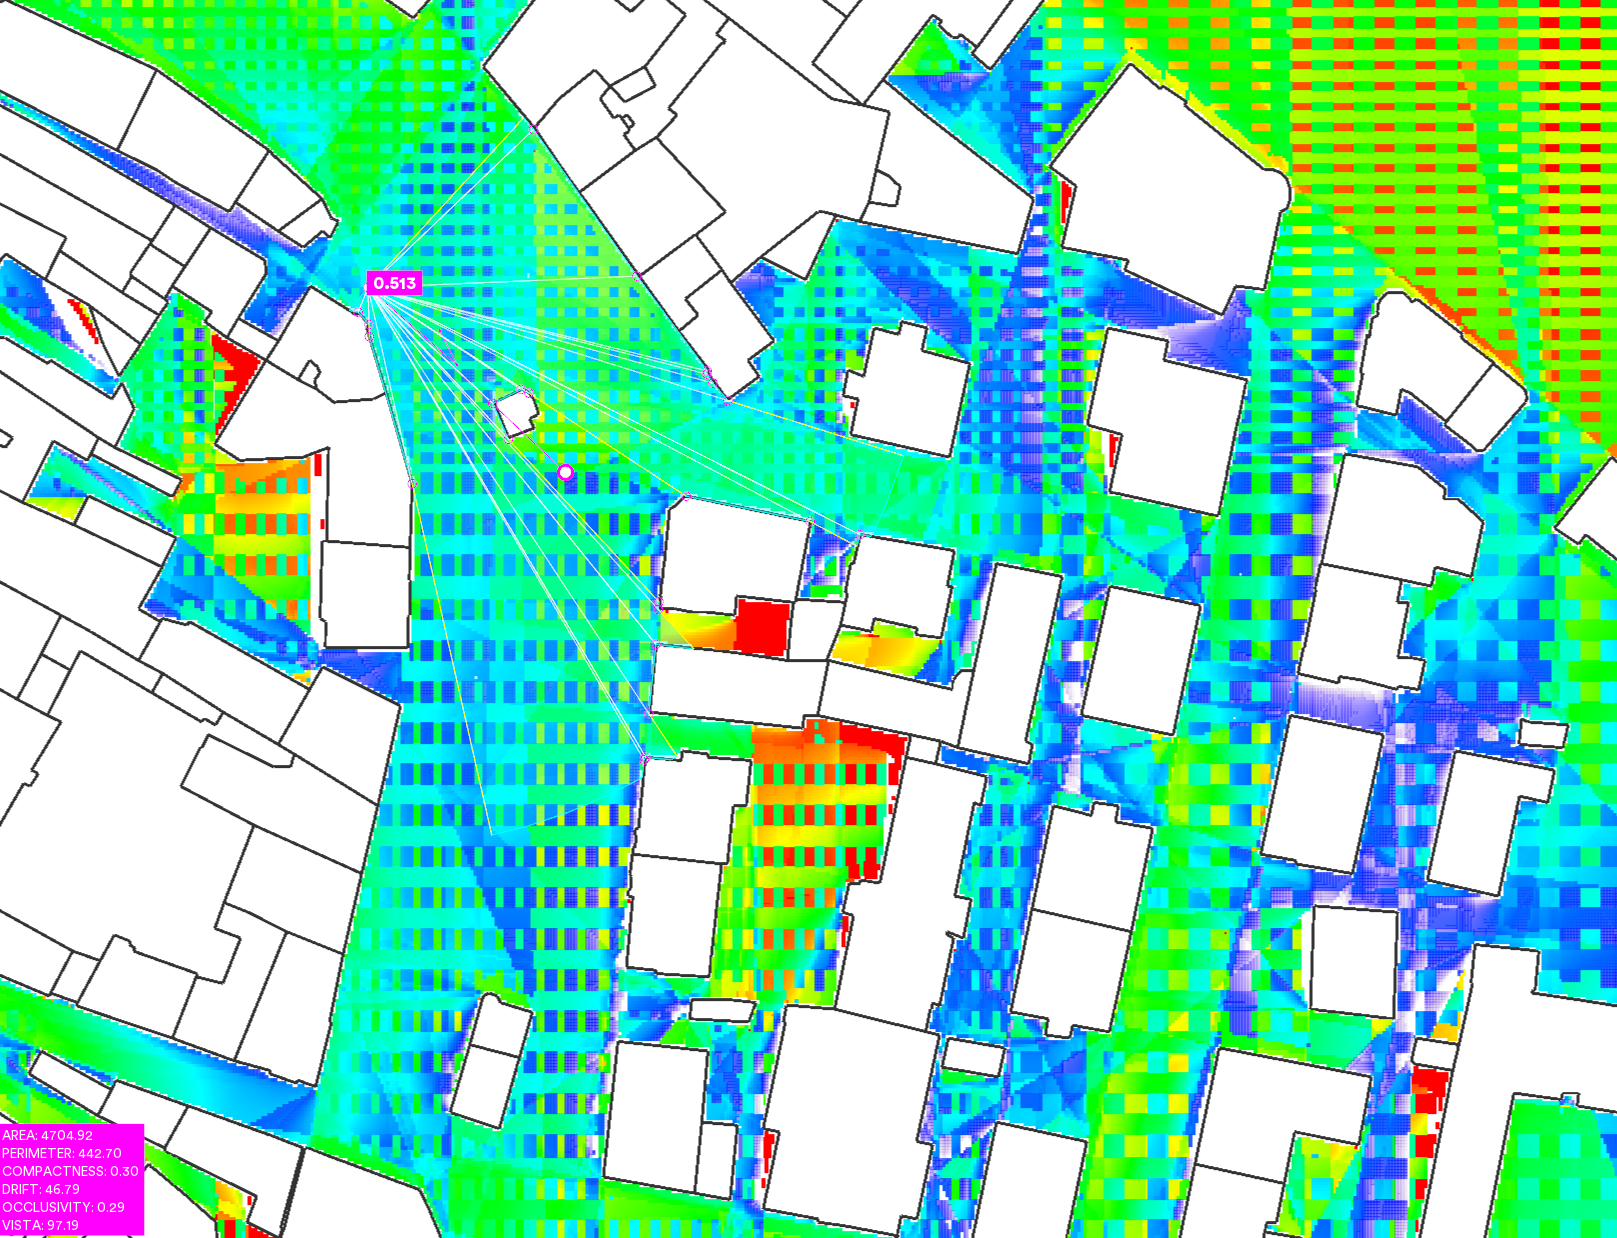
Occlusivity (Ov) expresses the proportion of edges of an isovist that are not physically defined. It represents how previously unseen space may be revealed during movement [4][5]. Occlusivity fields show moments of dramatic visual change as a user passes between spaces. A forest or hypostyle hall has high Occlusivity; a convex room has none; flat surfaces tend to extend occlusive edges into space.
Vista Length
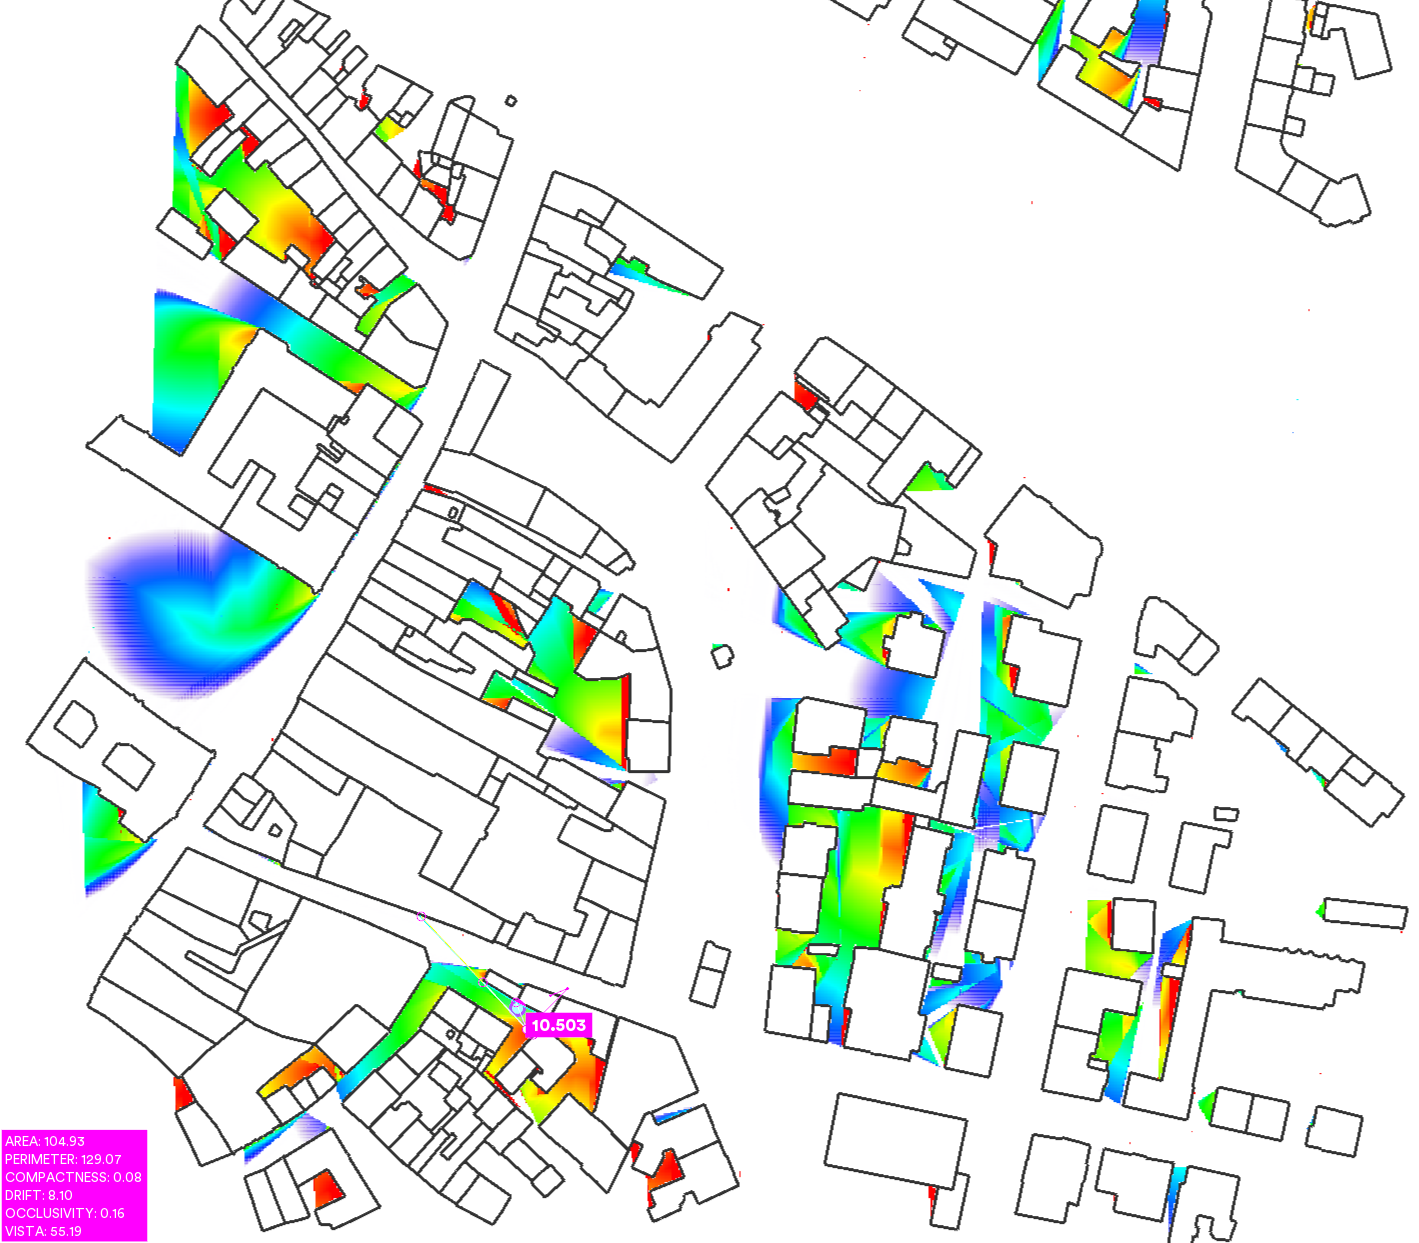
Vista Length (Hv) expresses the longest single view available at each location. In isovist terminology, it records the longest radial of the isovist at a location. Vista Length values identify regions of high axial view.
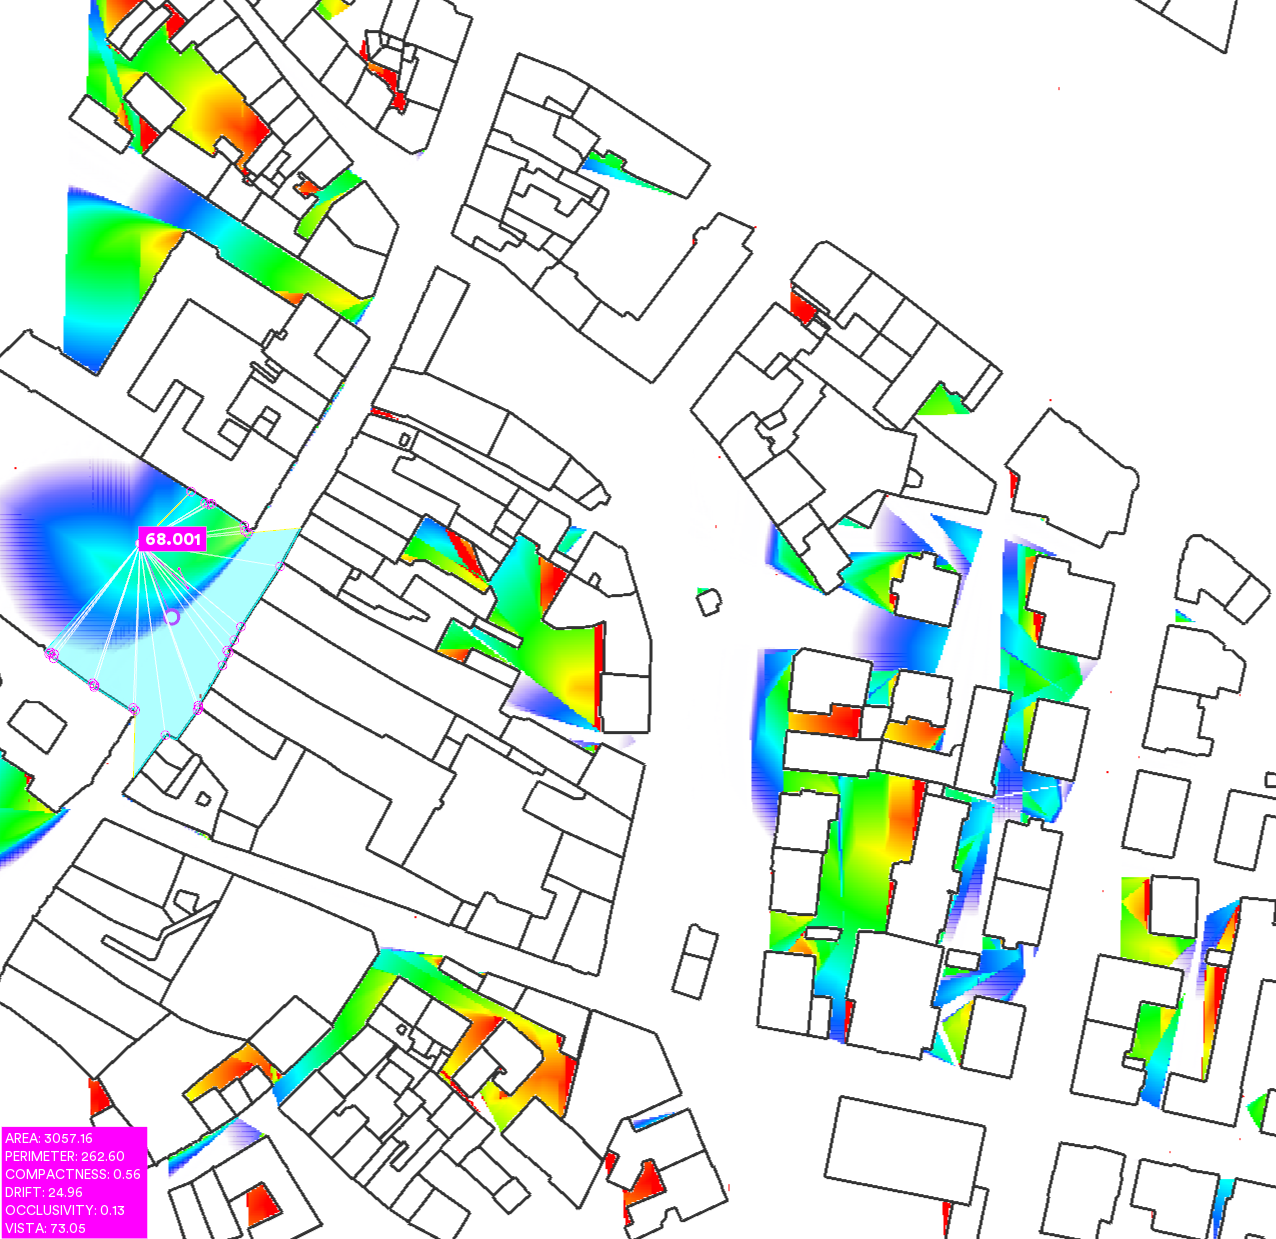
Average Radial
Average Radial (Qv) expresses the mean view length of all space visible from a location. In visibility graph terminology, it relates to the ‘through vision’ at a location [6]. In isovist terminology, it represents the mean radial length at a location.
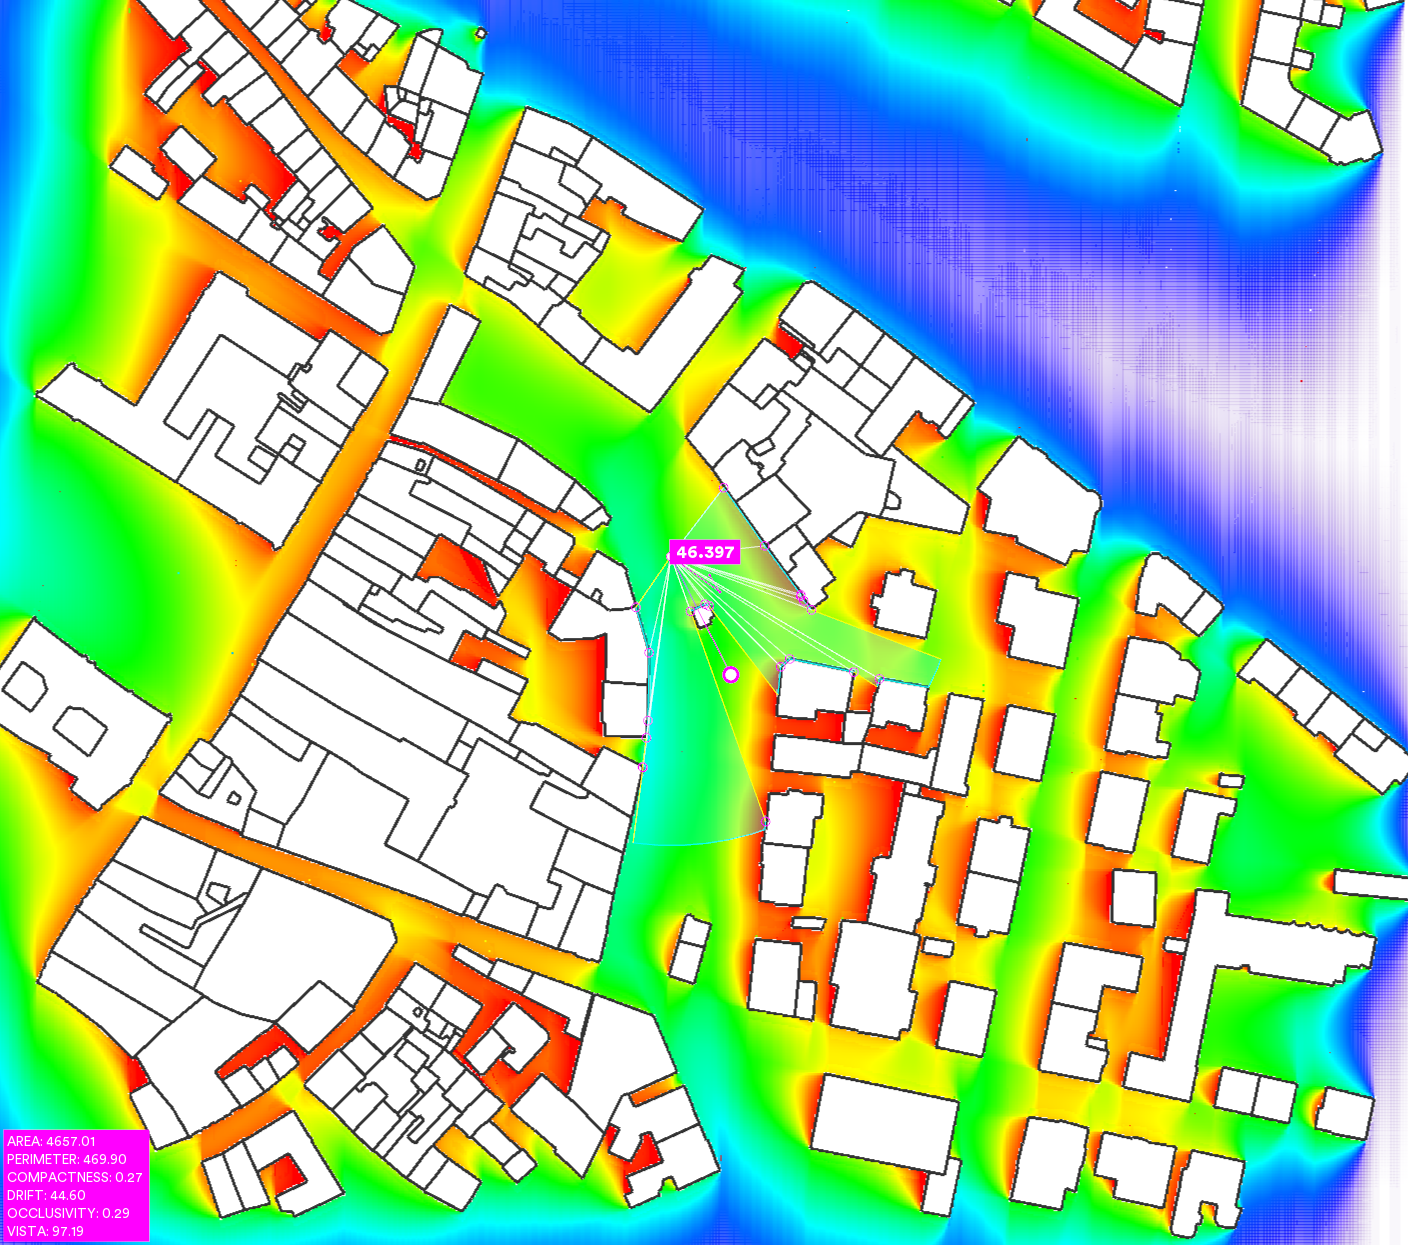
Drift
Drift (Dv) expresses the distance from a subject point to the centre of gravity of its isovist.24 In an isovist field, drift identifies the inherent ‘flow’ within a series of spaces, or the ‘pull’ or ‘push’ one might feel from the volume of space itself. To move along contours low in Drift is to be in the centre of one’s isovist, and so be visible from all directions. High Drift identifies regions from which space can be surveyed with a minimum of head turning.
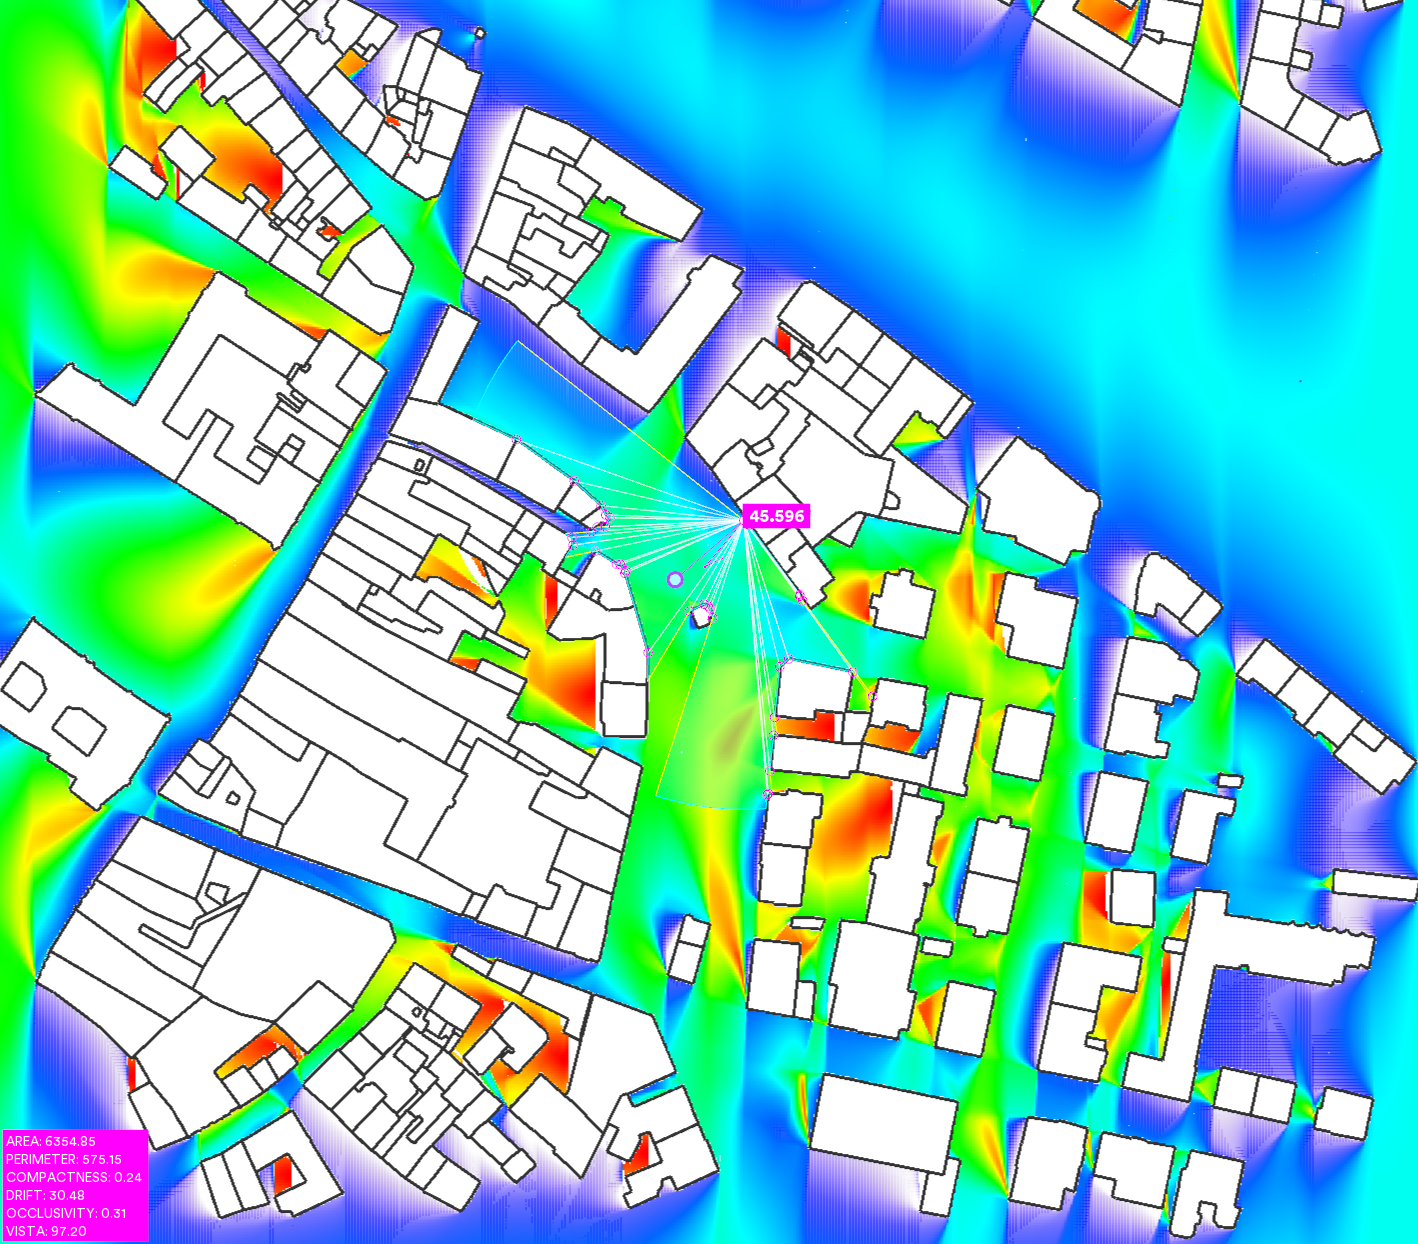
Variance
Variance (Tv) expresses the mean of the square of deviation between all radial lengths and average radial length of an isovist. In visibility graph terminology, it [7] represents the point second moment for a location. Variance indicates both the complexity and eccentricity of an isovist. It takes other measures to sort out which.
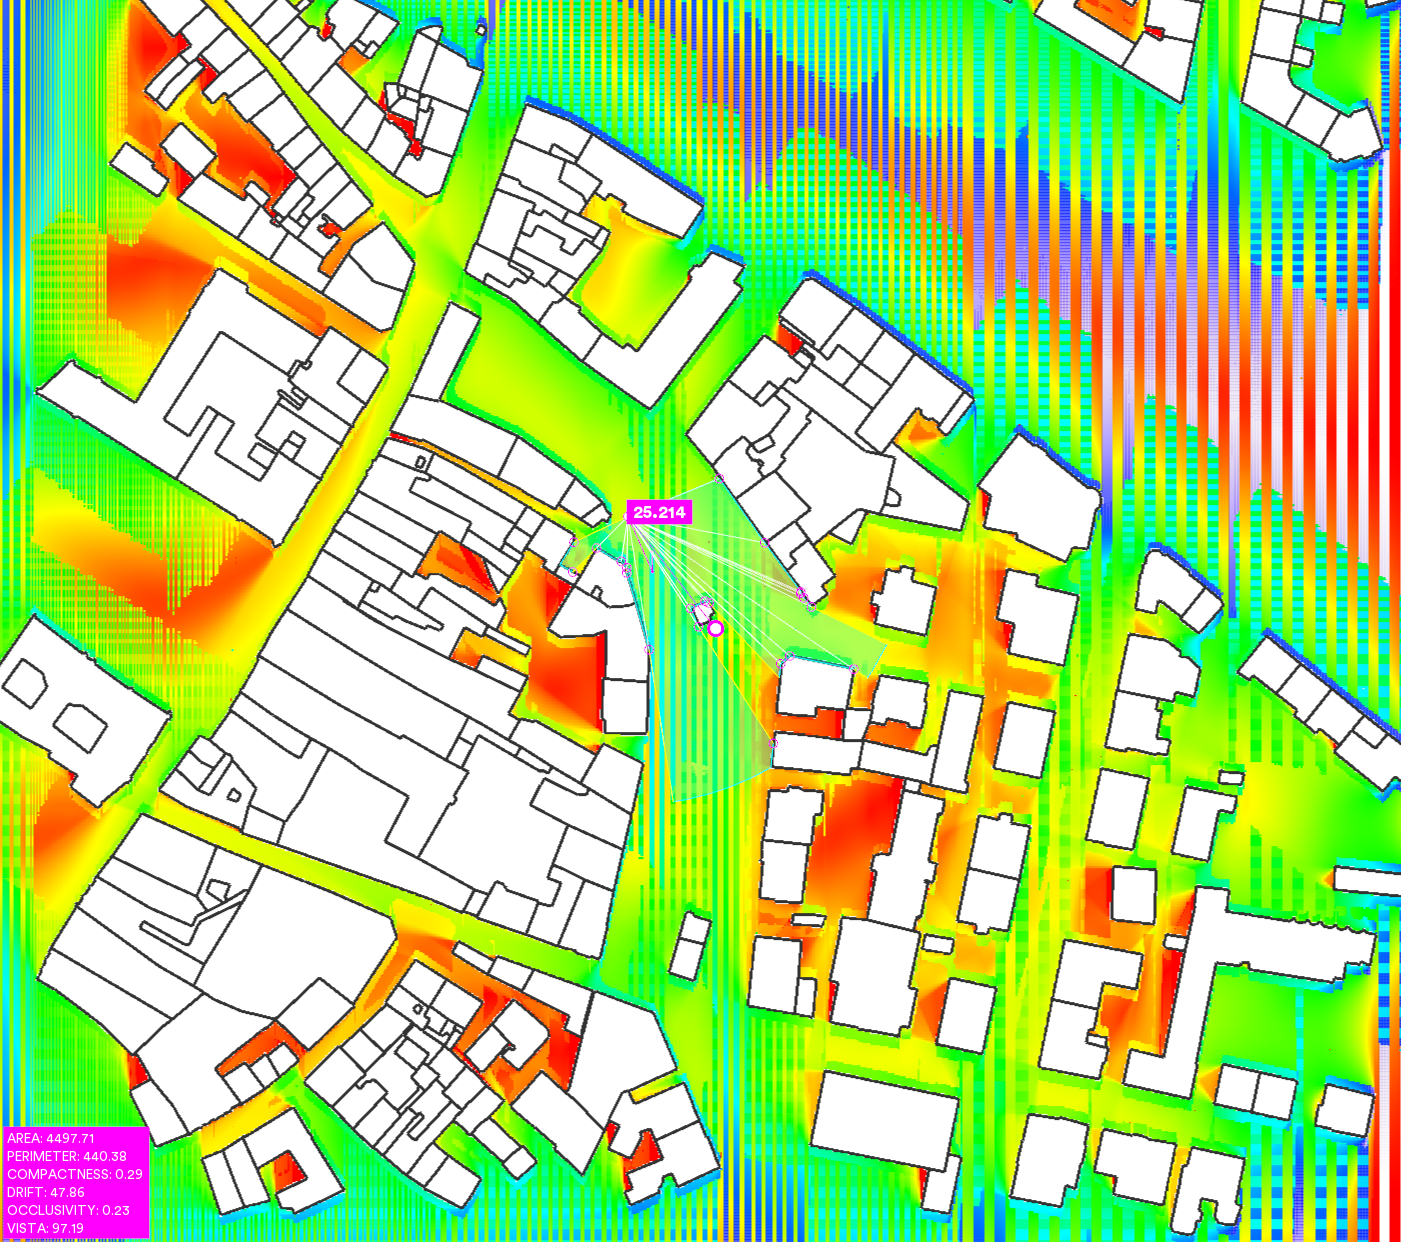
Space Syntax Analysis
Directed Visibility
Directed Visibility (Wv) expresses how often any given subject point is seen from a defined sample region. In isovist terminology, it represents how often a space falls within an isovist generated from within said region. Isovist_App visibility correlates to Area and Connectivity when the space being viewed exactly matches the sample region; but varies significantly, introducing a degree of direction once the sample region is restricted.
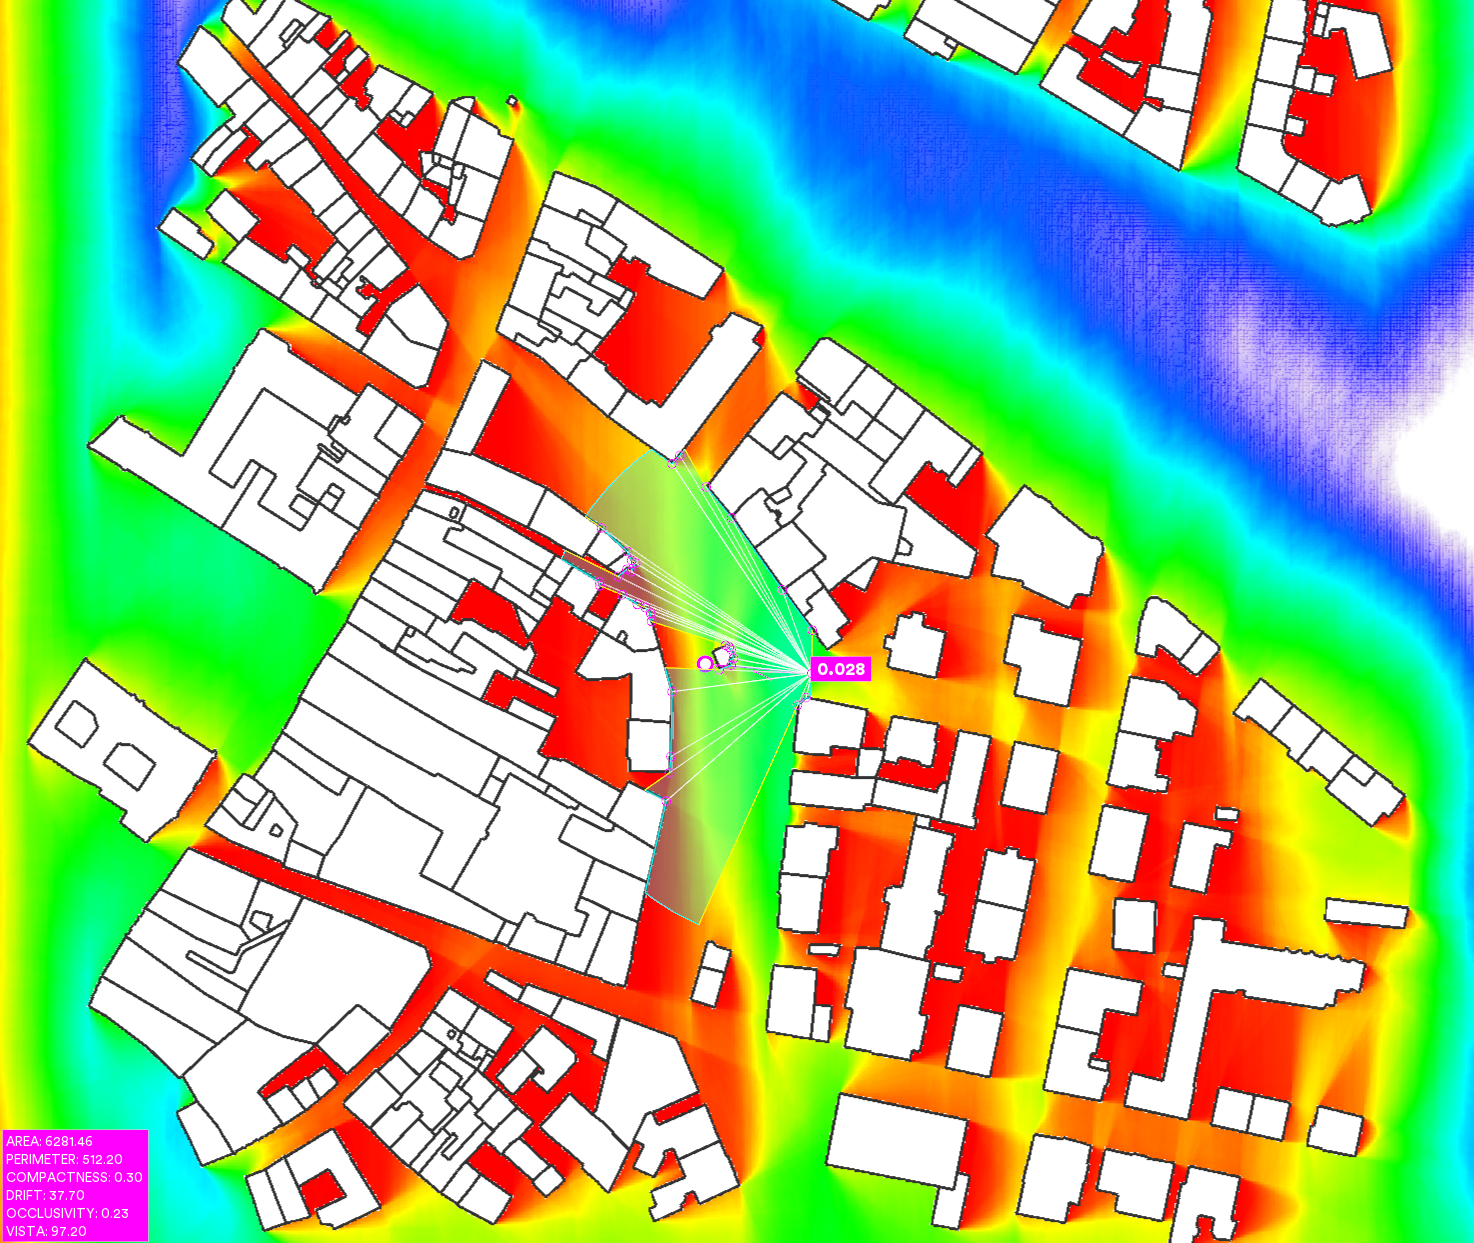
Co-visibility
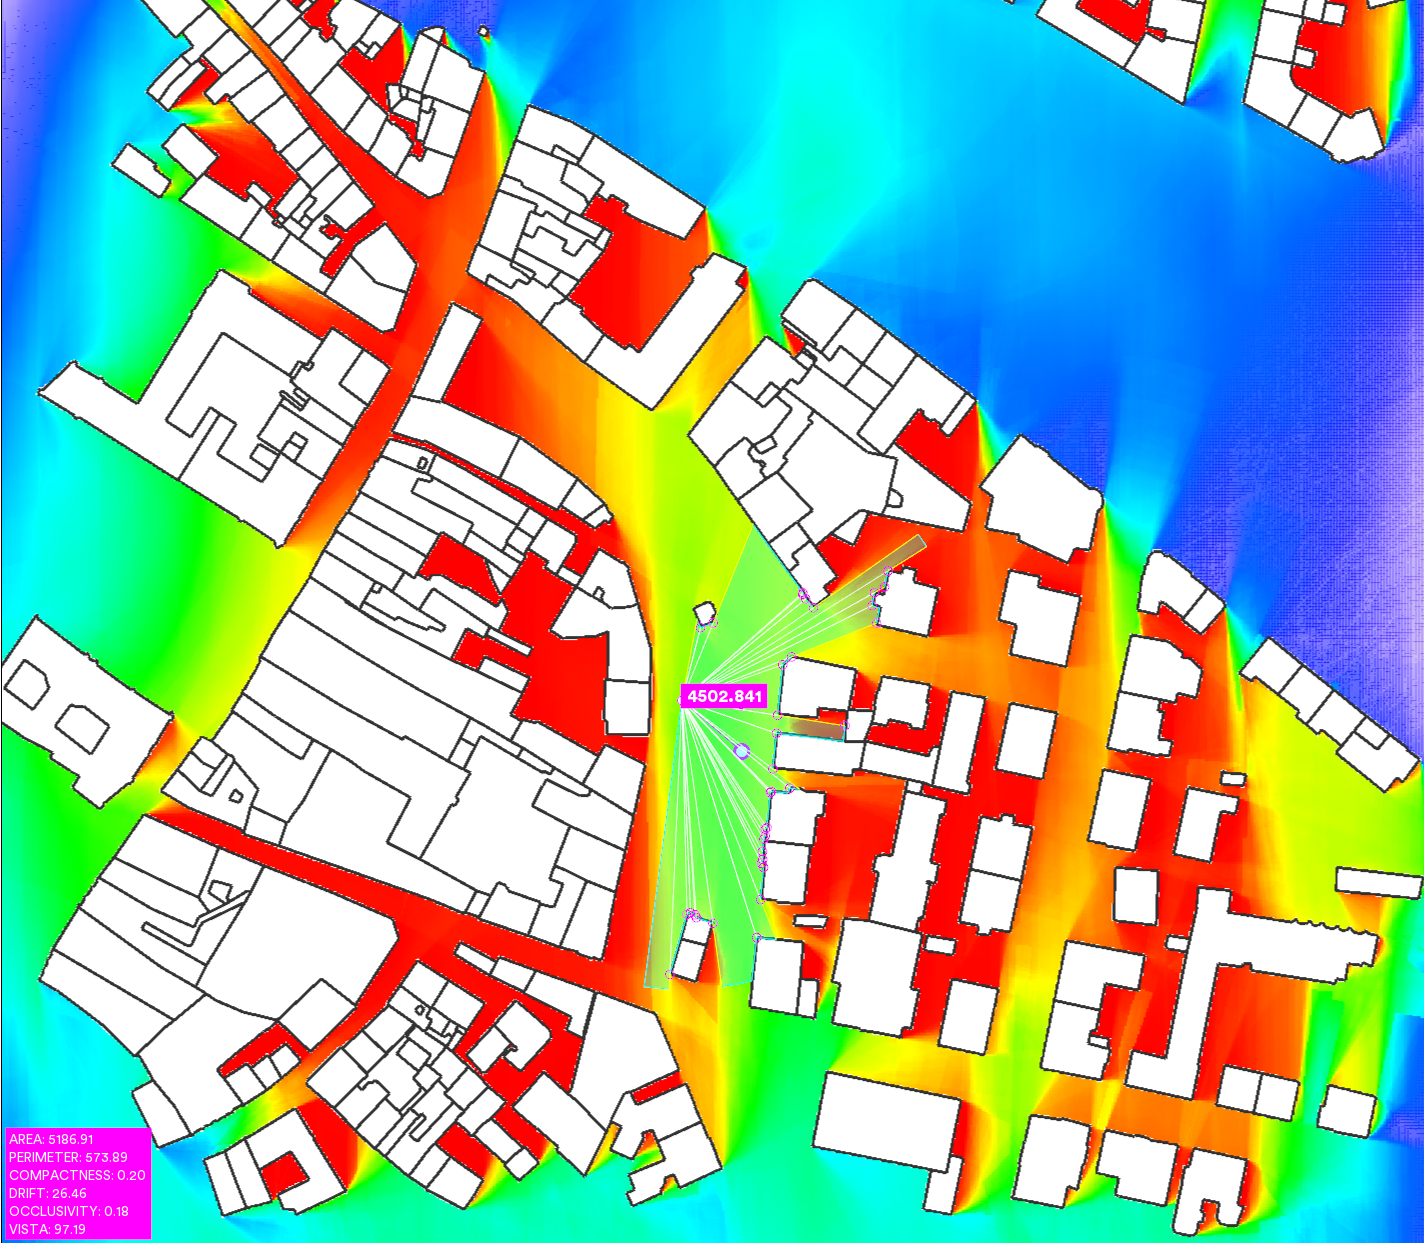
Overt Control
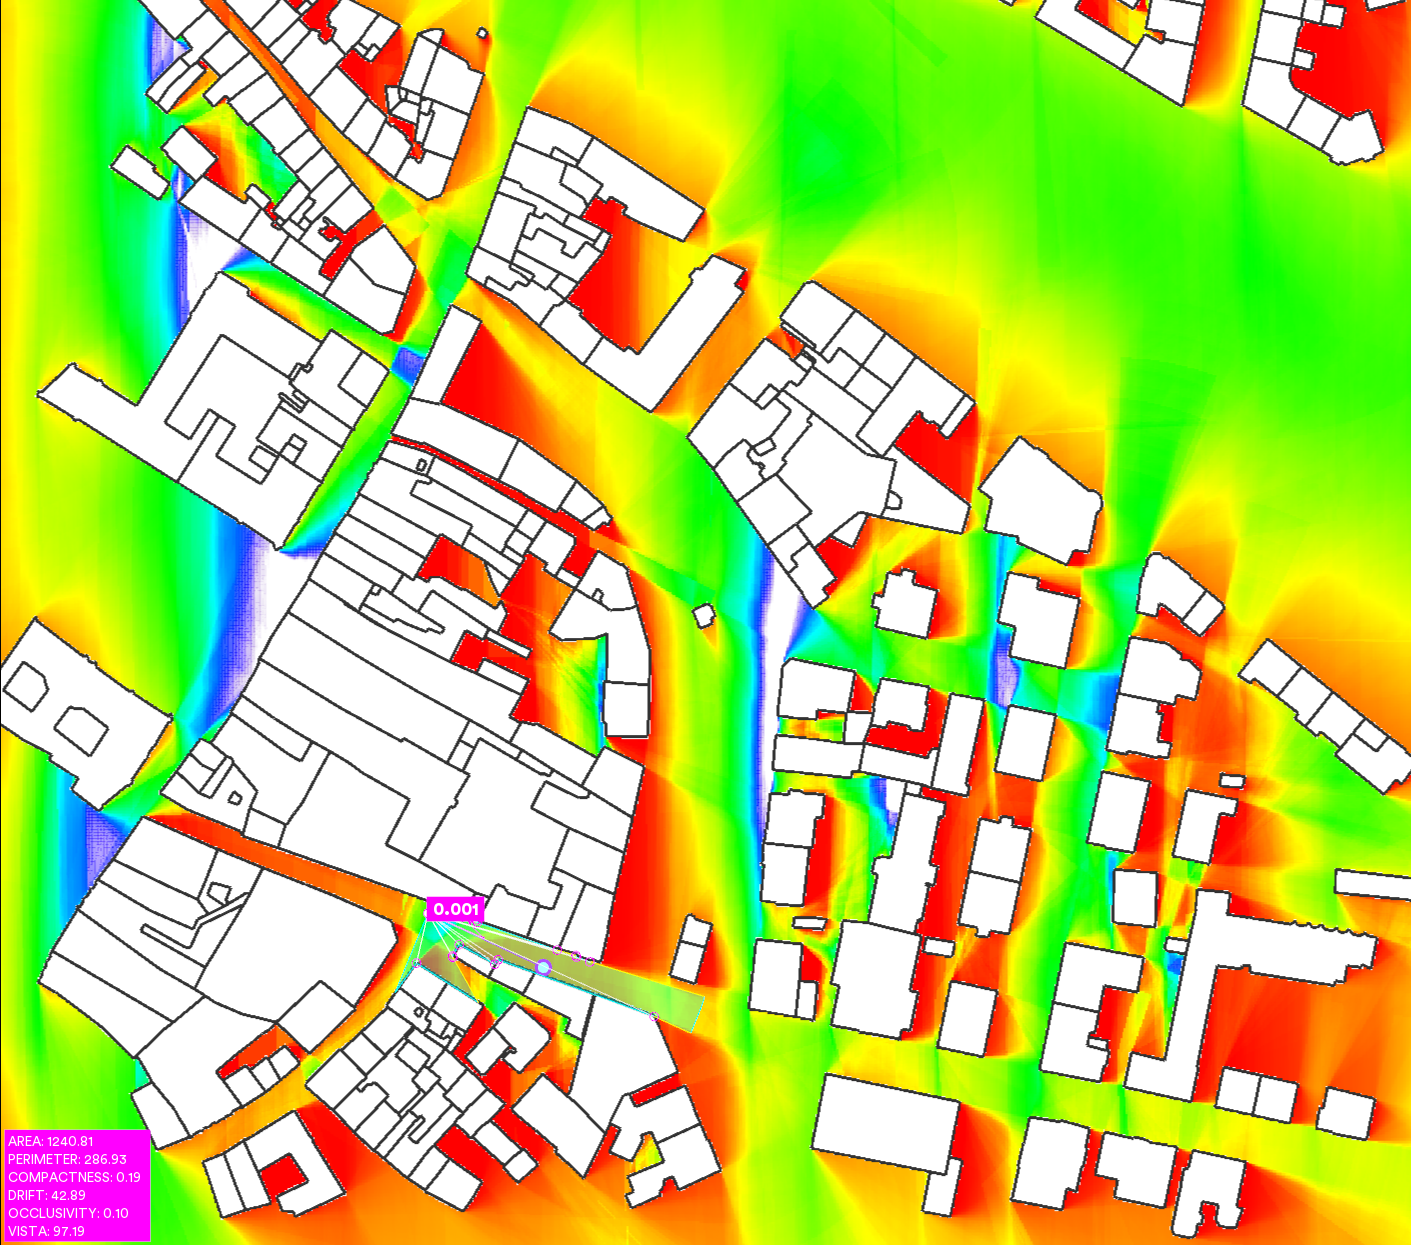
Covert Control
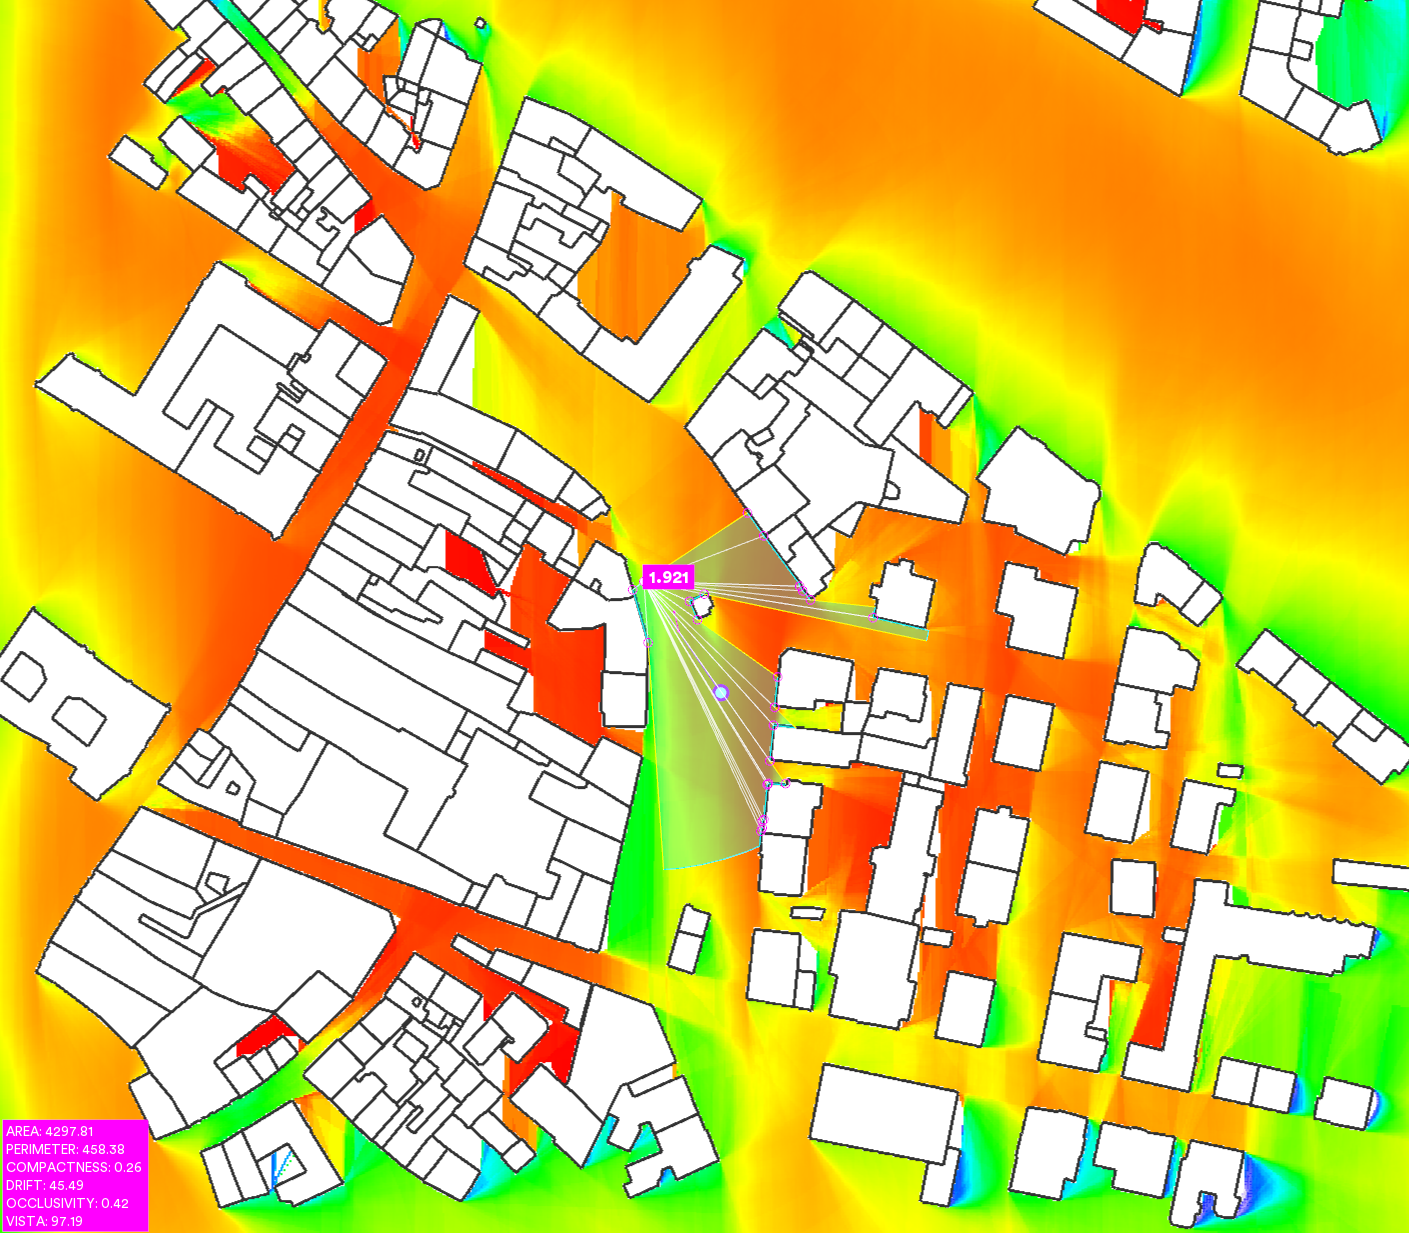
Counterpoint
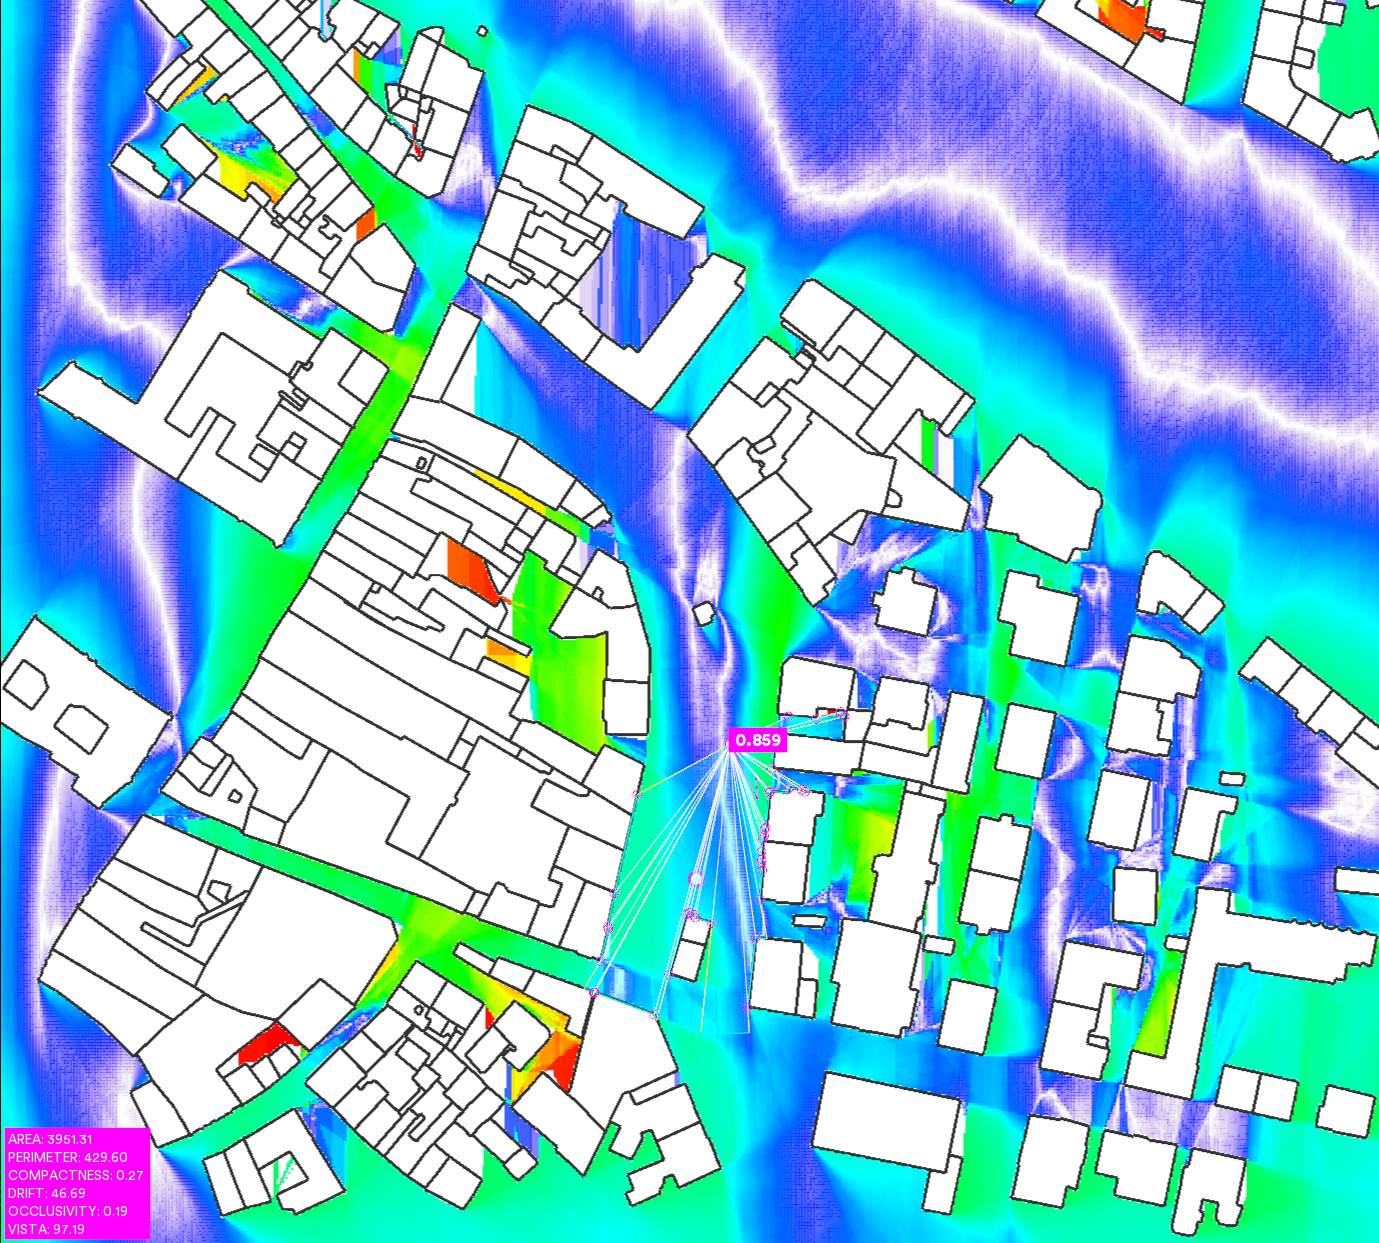
Choice
Metric Depth
Mean Metric Depth
Visual Depth
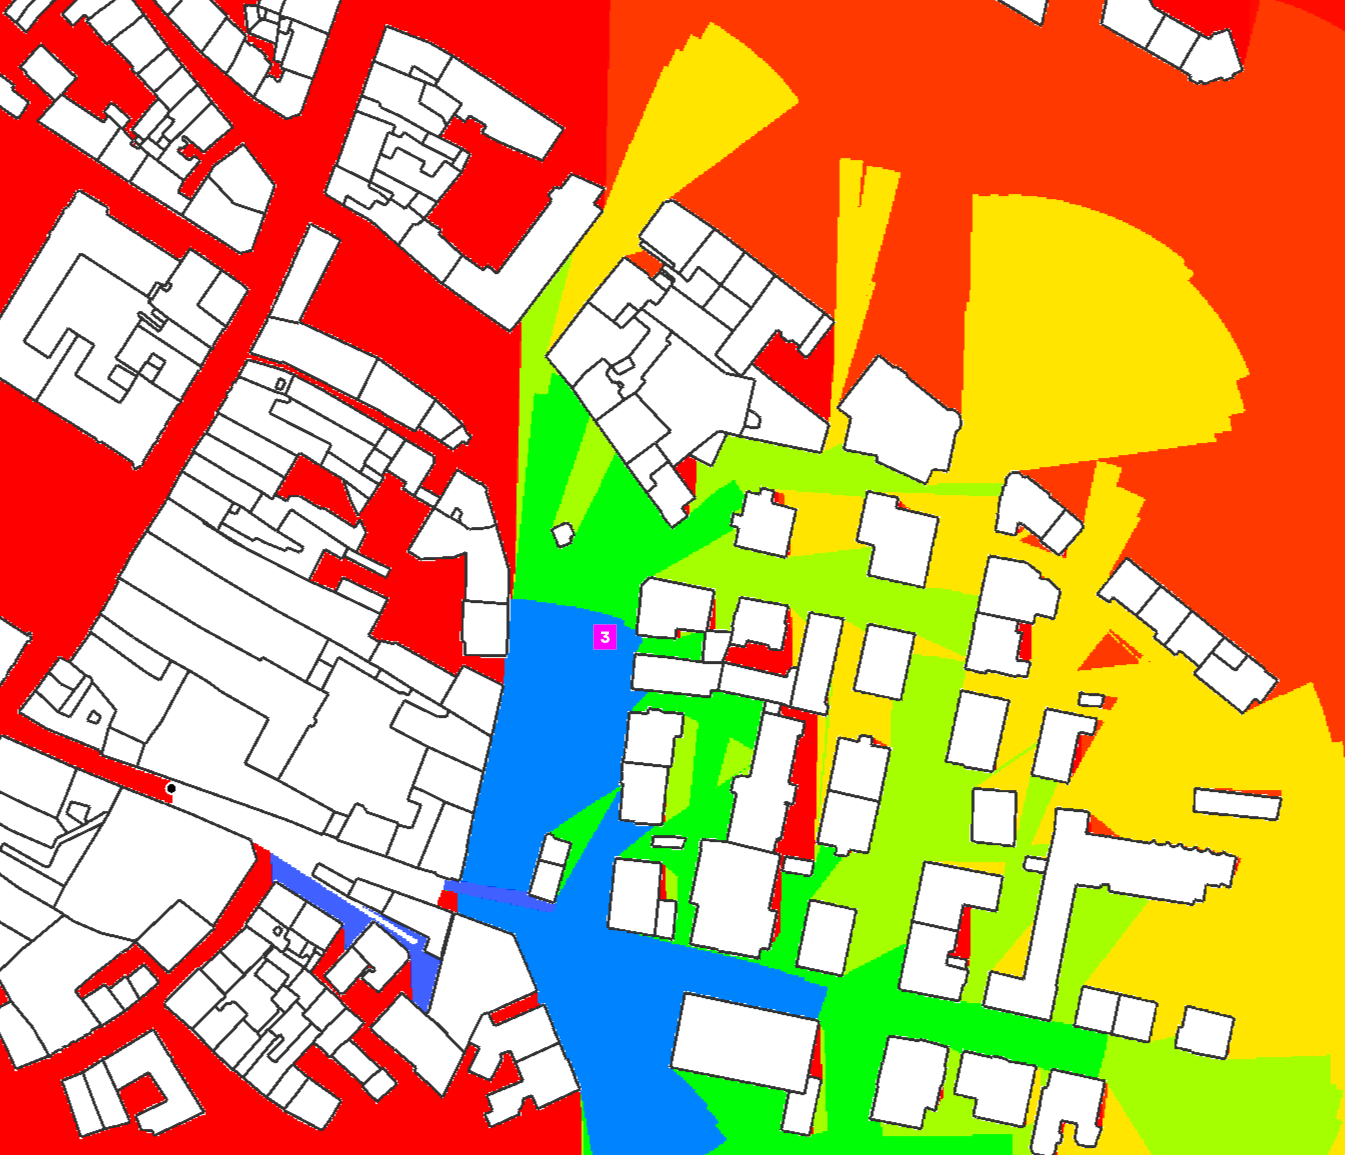
Mean Visual Depth
Angular Depth
Mean Angular Depth
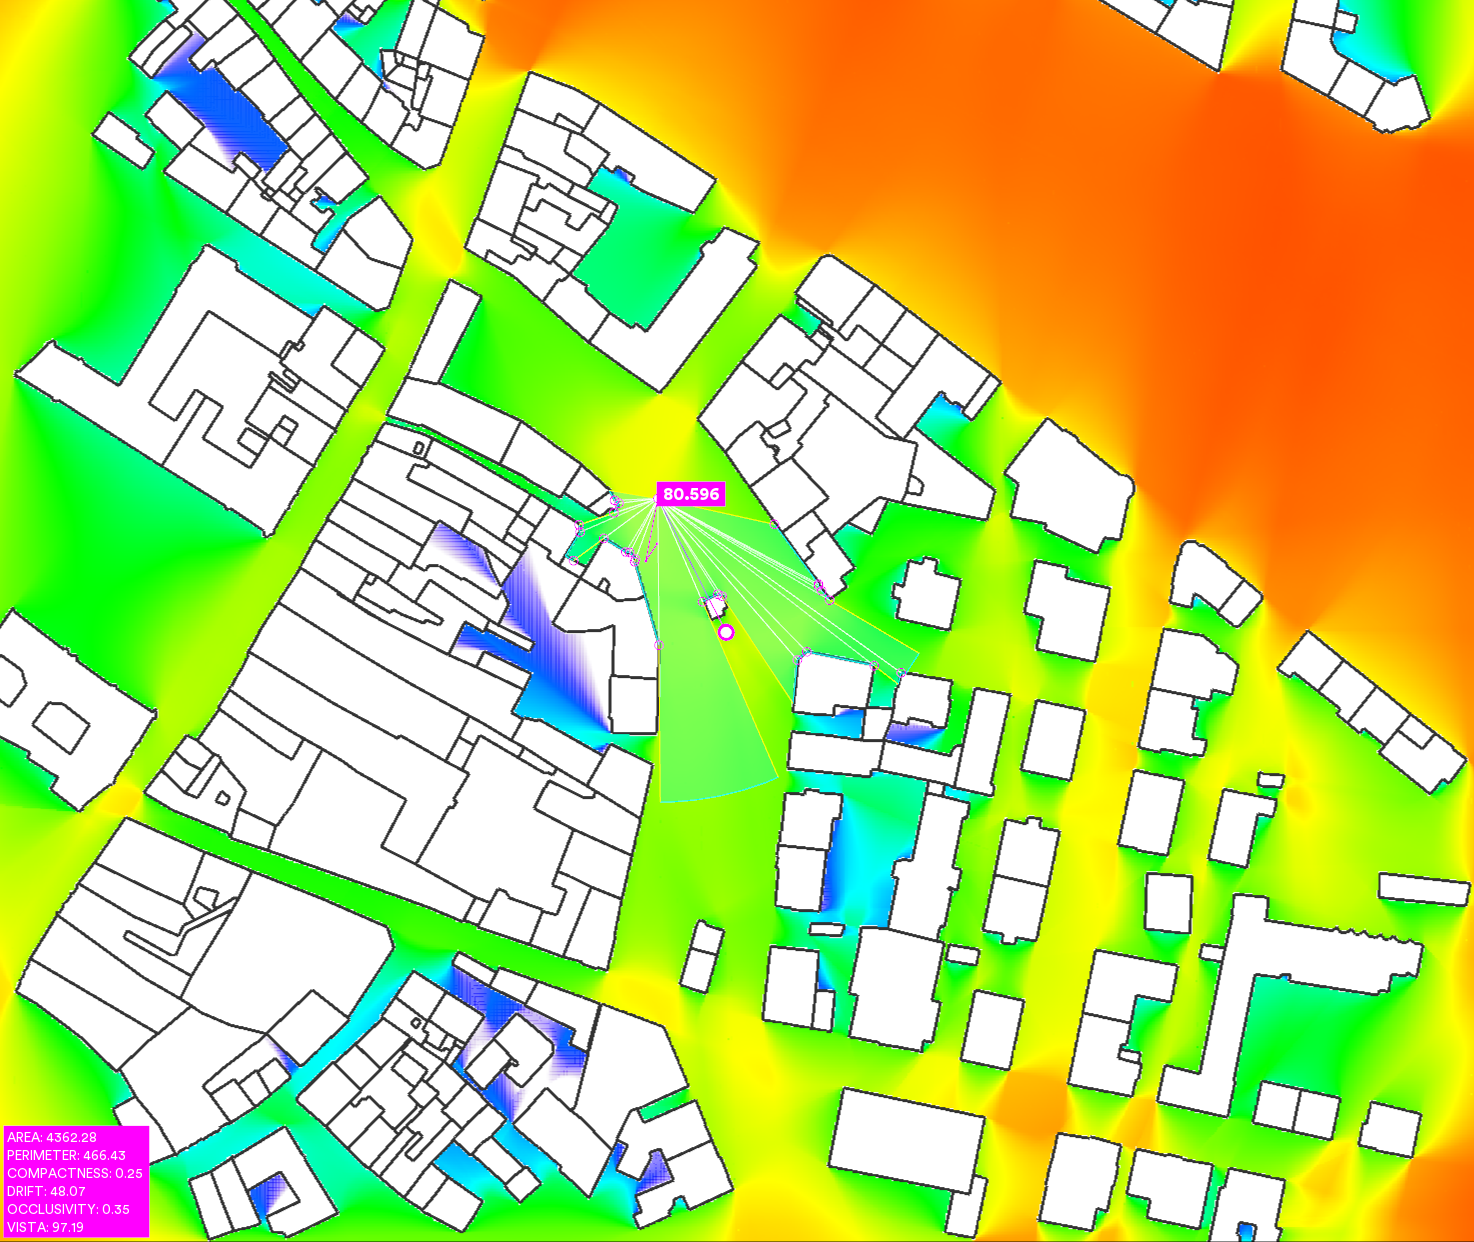
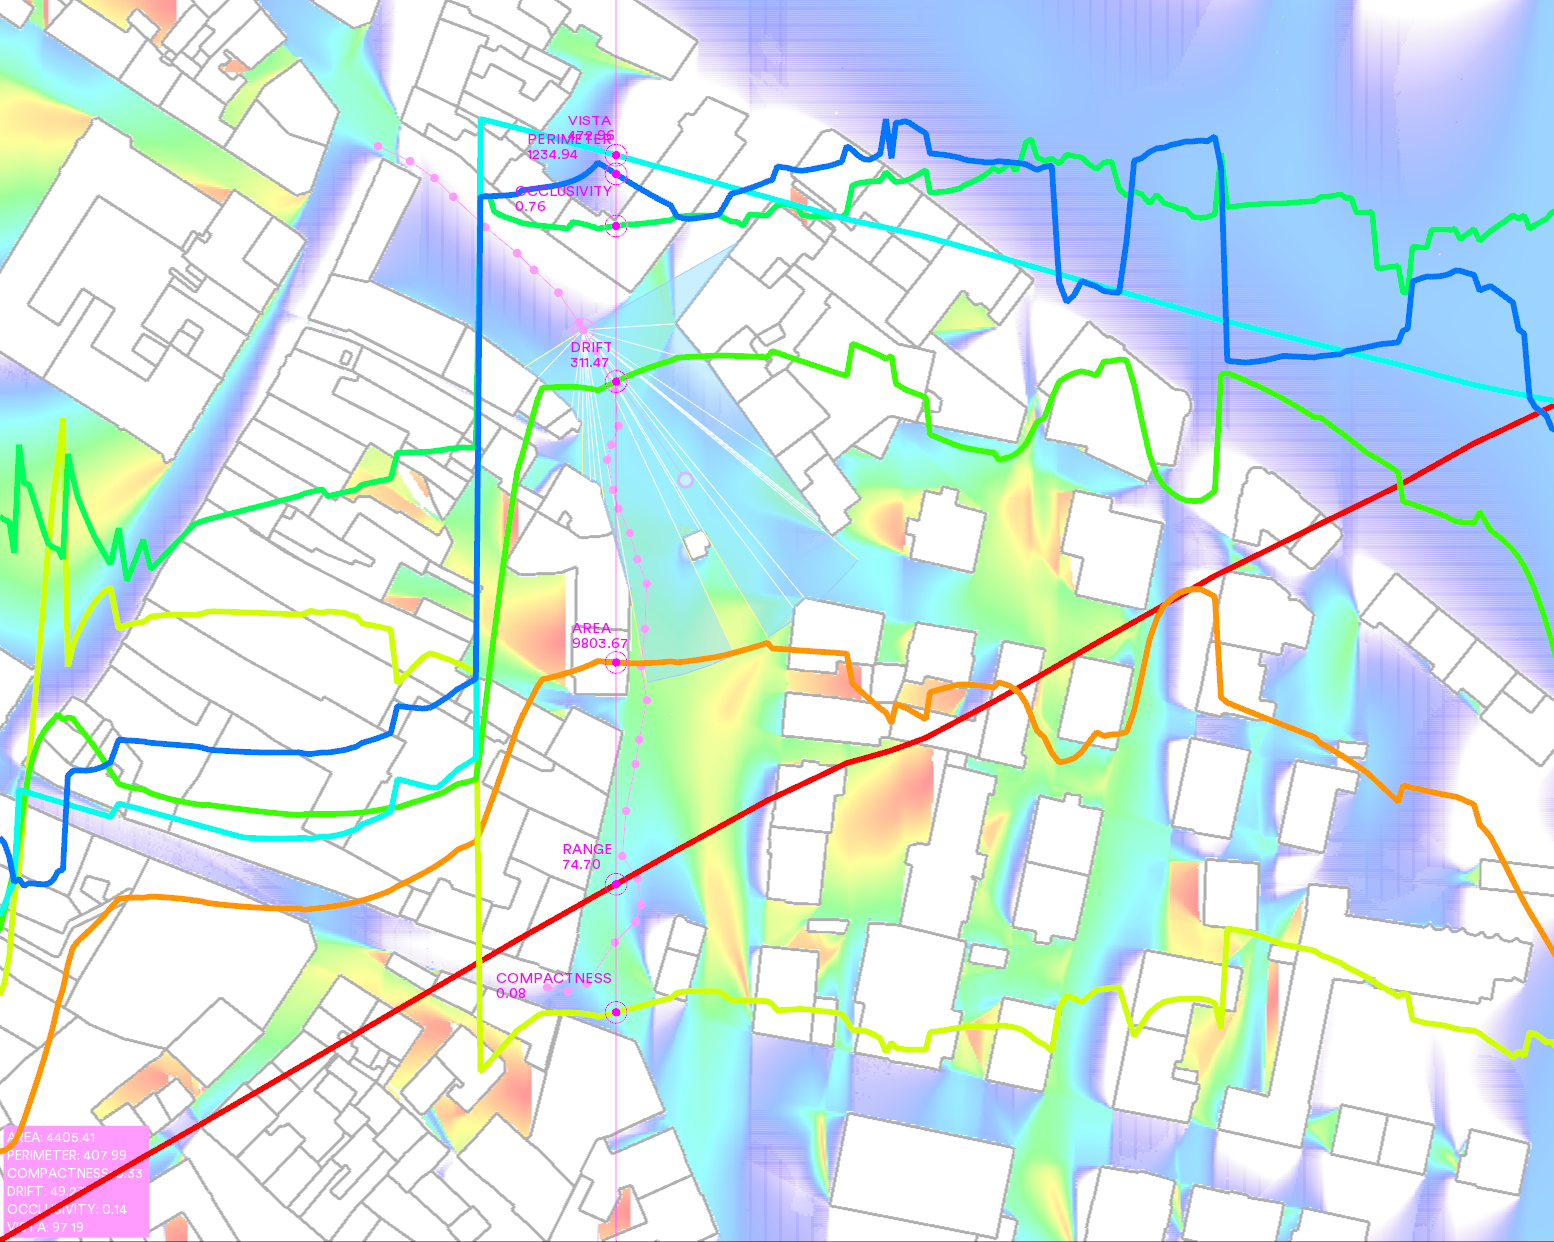
Path Analysis
References
[1] McElhinney, Isovists.org (2022). Isovist_app (Version 2.4.9.24). (Accessed on date 31.10.2025)
[2] McElhinney, (2024). Mean aggregate isovist cascade analysis; a temporal approach to spatial analysis. In Proceedings, 14th international Space Syntax Symposium, Nicosia; pp 1949–1976. Gruppo editoriale Tab Srl Benedikt, M and McElhinney, S (2019). Isovists and the metrics of architectural space. In ACSA 2019 Annual Meeting Proceedings. ACSA Press.
[3] Peponis, J; Wineman, J; Rashid, M; Hong Kim, S; Bafna, S. (1997) ‘On the description of shape and spatial configuration inside buildings: convex partitions and their local properties’; Environment and Planning B. v24: pp. 761-781.
[4] Benedikt, M. (1979). ‘To Take Hold of Space: Isovists and Isovist Fields’. Environment and Planning B. v6: pp.47-65.
[5] Gibson, JJ (1979), The Ecological Approach to Visual Perception, Boston, MT:Houghton, Mifflin & Co.
[6] Turner, A. (2007). ‘To move through space: lines of vision and movement’, Proceedings, 6th 23 International Space Syntax Symposium, İstanbul.
[7] Psarra, S and McElhinney, S. (2014) ‘Just around the corner from where you are: Probabilistic isovist fields, inference and embodied projection’, The Journal of Space Syntax, v5: pp. 109-132.